Diagnostics Overview
Access to the Diagnostics page requires an active applicable subscription to OutWatch.
Overview
The Diagnostics module provides a range of details about screens and their performance. When you click Diagnostics, you should see a list of your screens and their current status. To see a snapshot of data about a specific screen, click on the screen from the left-hand menu.
You are able to adjust the snapshot information that is shown beneath the screen name by clicking the dropdown menu and selecting the detail you'd like to view.
If a field is truncated, you can hover your mouse over it to see the full name.
Screen Filter
There is a search field where you can input the screen name, or part of the screen name, and it will filter the list. This can also be used to search by a certain tag assigned to your screen (i.e. screen code or location)
Screen Status Icon
The Screen Status icon tells you at a glance whether your screens are playing, which ones have outstanding errors, and how many errors a screen has.
The number in the circle indicates the total number of errors for that screen.
The shape inside the icon provides information that tells you if the screen is playing.
| Shape | Description |
|---|---|
 | The screen is playing. |
 | The screen has stopped playing. |
| The screen is not currently connected. |
The status icon is colour-coded according to error type and represents the most severe error on that screen currently, even if there is only one at that severity.
The colours give a quick indication of which screens may need attention.
| Colour | Description |
|---|---|
| Green | The screen has no errors, or all of the errors have been assigned. |
| Yellow | The most severe error present is a warning. These errors indicate when operations are outside of the preset thresholds. They may not typically require immediate action but collectively, they may indicate an issue. |
| Orange | The most severe error present is a critical warning, and there may also be warnings present. Critical warnings indicate when operations heavily exceed the thresholds and although they may not require immediate action, they will need attention very soon to prevent a more severe fault. |
| Red | The most severe error present is a visual fault, and there may also be critical or regular warnings. Visual errors are likely to affect what is seen on the screen and will generally need immediate attention. |
| Grey | The screen has lost connection to OutWatch. |
If a screen has stopped or offline, it will be highlighted in red.
Status View
Once a screen is selected, detailed information about the screen and any errors will be shown in the main pane.
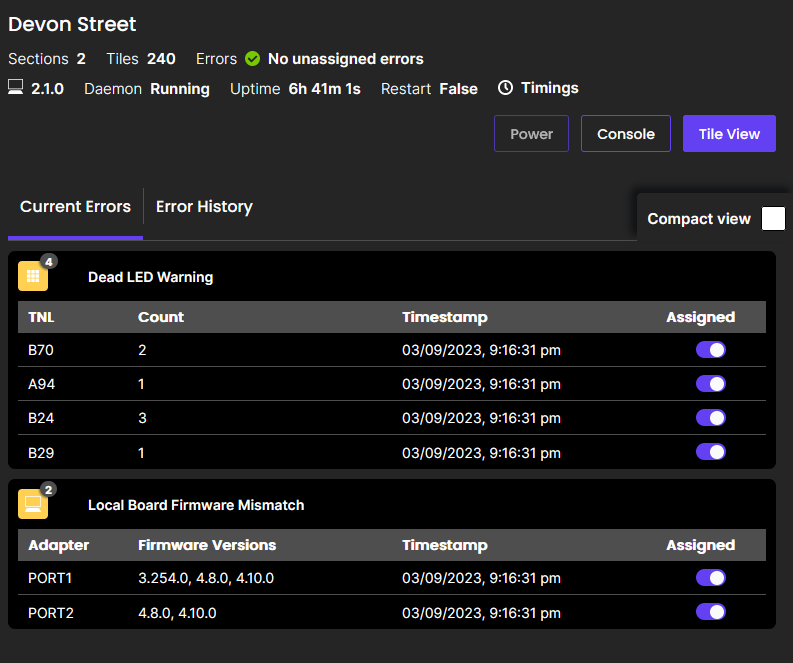
If you wish to collapse the list of errors to review errors in groups, click the Compact View checkbox. You can uncollapse or collapse an error group by clicking on it. At any time, you can click "collapse all" to collapse all open groups.
Assigning Errors
Errors can be marked to show as assigned so that you can see which errors need immediate attention and which are in progress. Assigning all errors of a certain type of error will prevent the corresponding colour from showing in the left hand sidebar. If you only have warnings, assigning all those warnings will result in a "healthy" reading on the sidebar.
This can be done with individual errors or by clicking the Assign all outstanding button, which appears when there are outstanding errors.
Error History
You can access a detailed error history from the Error History tab.
This allows you to narrow down errors to a specific timeframe. You can filter a search to show all errors of a particular severity level, or a specific error code.
To access error history, you must specify a date and time range, and the specific (or all) error codes you wish to view. Pressing "Apply" will generate all the logs for the requested critera.
Console
The console is available to users with Candelic screens. Please contact OutWatch for more information.